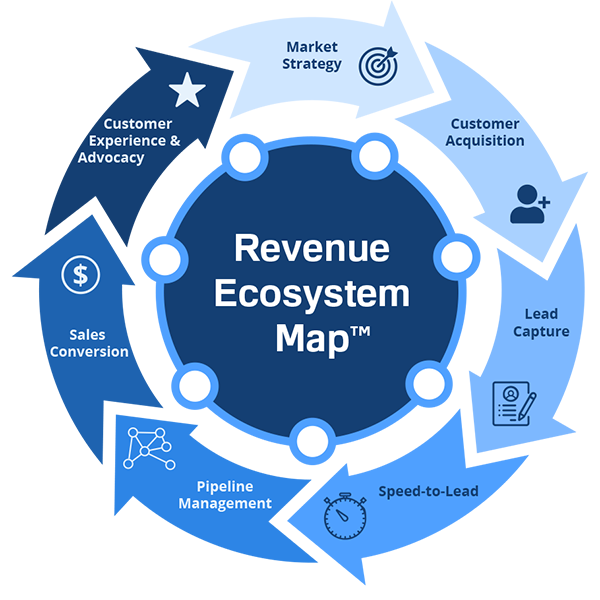
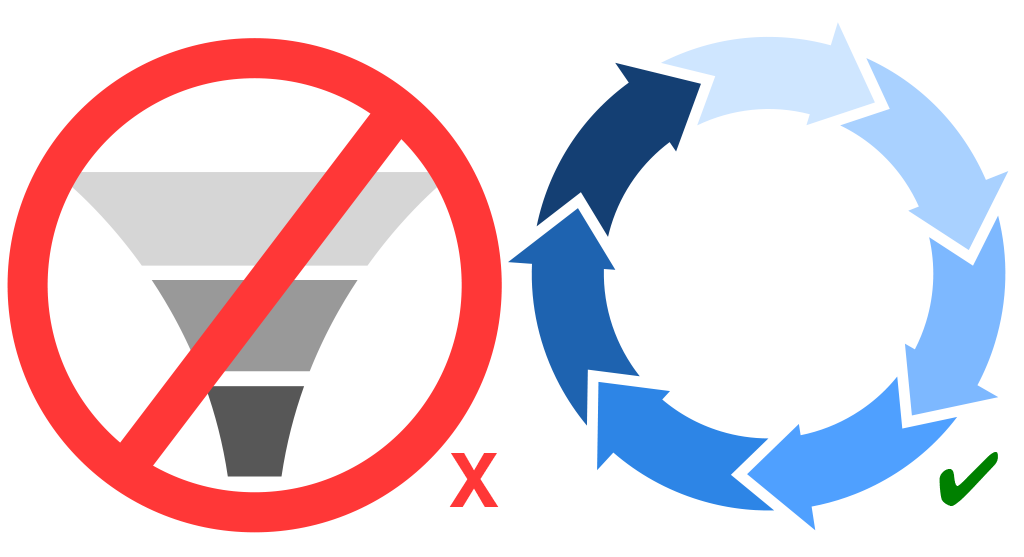
Most businesses think in funnels – linear, one‑way, ending at the sale. But real revenue systems are circular. The Revenue Ecosystem Map™ provides a shared framework for understanding how Market Strategy, Acquisition, Lead Capture, Speed‑to‑Lead, Pipeline Management, Sales Conversion, and Customer Advocacy work together as an integrated system.
The Revenue Ecosystem Map™ models the seven interconnected stages that influence revenue performance, customer flow, operational alignment, conversion efficiency, and long‑term growth.
Because each stage influences the others, inefficiencies in one area often create downstream effects throughout the broader ecosystem.
The 7 Stages:
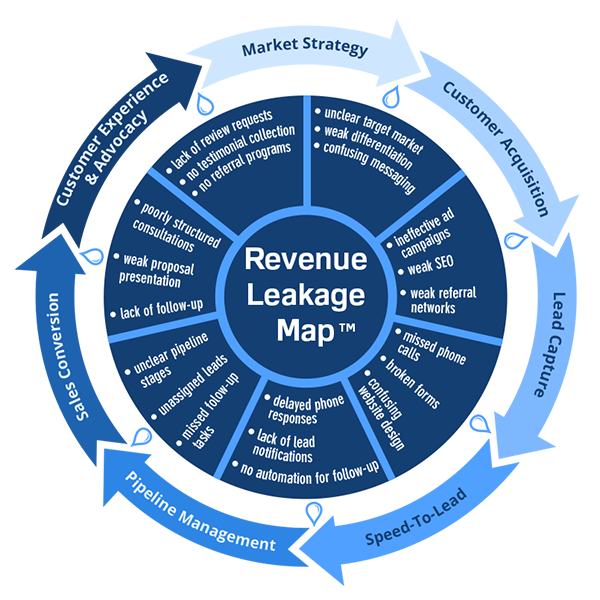
When one stage underperforms, downstream results suffer.
When the ecosystem is aligned, growth becomes more measurable, scalable, and efficient.
Traditional funnels imply one‑way movement: lead → prospect → customer. But real revenue systems behave differently. Value loops back.
The key feedback loops in the ecosystem:
Customer Experience & Advocacy (Stage 7) feeds back into Market Strategy (Stage 1) – reviews, referrals, and testimonials attract new leads and strengthen positioning.
Customer Experience & Advocacy (Stage 7) also feeds back into Customer Acquisition (Stage 2) – strong retention lowers the number of new customers needed, reducing acquisition cost.
These loops mean every stage affects every other stage. That is why isolated fixes often fail. Improving one stage without understanding its downstream effects can break another.
| Metric | Current | Optimized |
| Monthly Leads | 200 | 200 |
| Close Rate | 20% | 25% |
| Avg Client Value | $5,000 | $5,000 |
| Monthly Revenue | $200,000 | $250,000 |
The Revenue Ecosystem Map™ is not just a diagram – it is the foundation for structured diagnosis.
When you understand how the 7 stages interact, you can:
The map is the conceptual backbone of the Revenue Pipeline Diagnostic™, which delivers a stage‑by‑stage Scorecard, Leakage Map, Architecture Diagram, Index, and prioritized roadmap.
The Revenue Ecosystem Map™ gives you a shared language for discussing growth. The next step is measuring your own system.
Or, if you are ready for a full analysis: